

Understanding the My Projects Tab
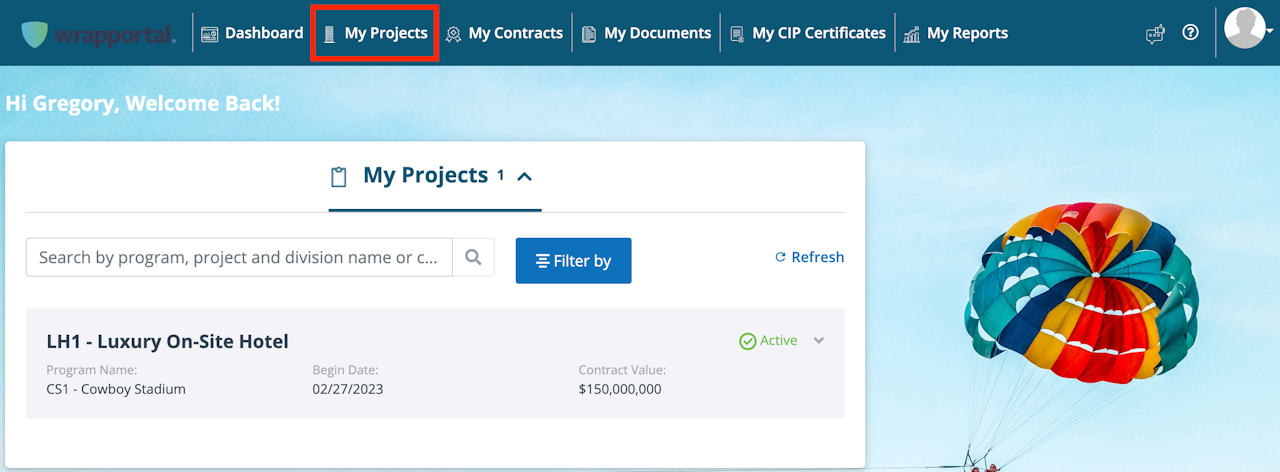
If the administrator has given access permissions for the My Projects tab, it will only display for sponsors and general contractors. Subcontractors do not have this feature.
For sponsors, all projects on their Future, Active, and Closed CIP programs will appear in the list of projects. Sponsors will be able to see all contractors tied to these projects when using any of the features in the My Projects module.
For general contractors, any projects on Future, Active, and Closed CIP programs in which the contractor is working as a GC will display in the list. If there are multiple Tier 0 contractors on the project, they will only see contractors that fall within their own hierarchy when using any of the features in the My Projects module.

Searching for Projects
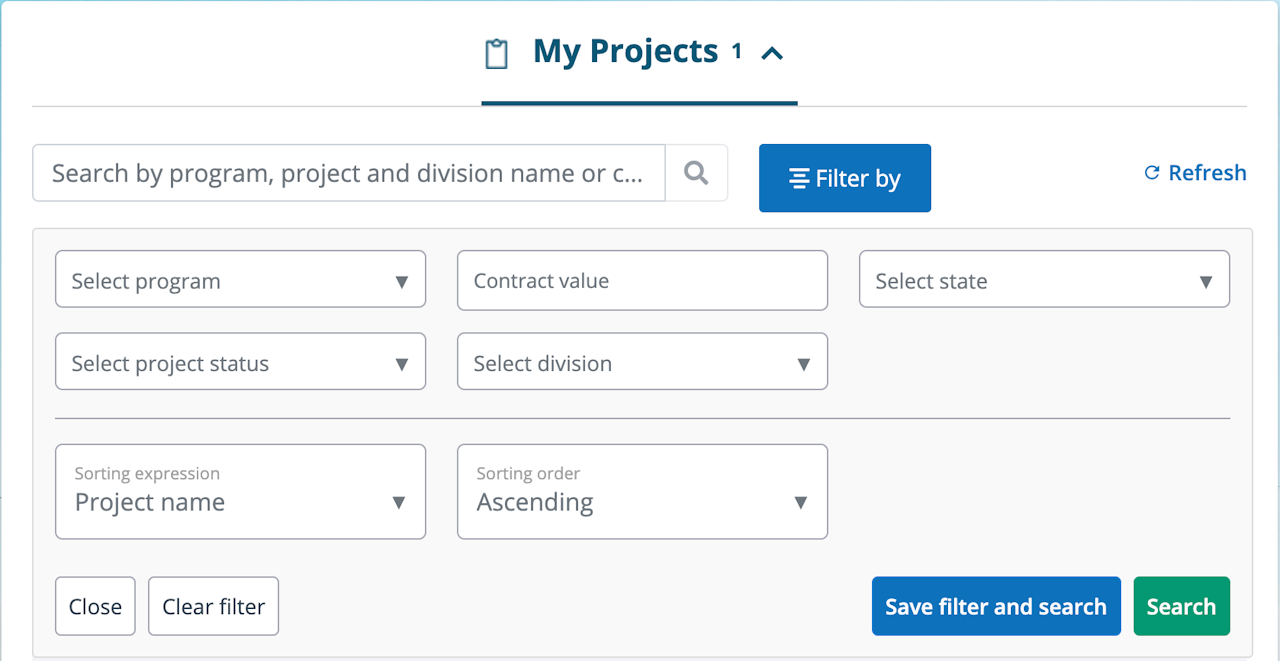
Use the “Filter by” button at the top of the project list to search for a specific project or to narrow down the list of projects. Sorting options can also be added to manage the organization of the projects in the list.
Use the “Save filter and search” button if you would like to save your filter selections so that your list of projects remains in the filtered organizational structure.
Use the “Clear filter” button to remove the saved filter and return to the default structure.

Project Preview Information
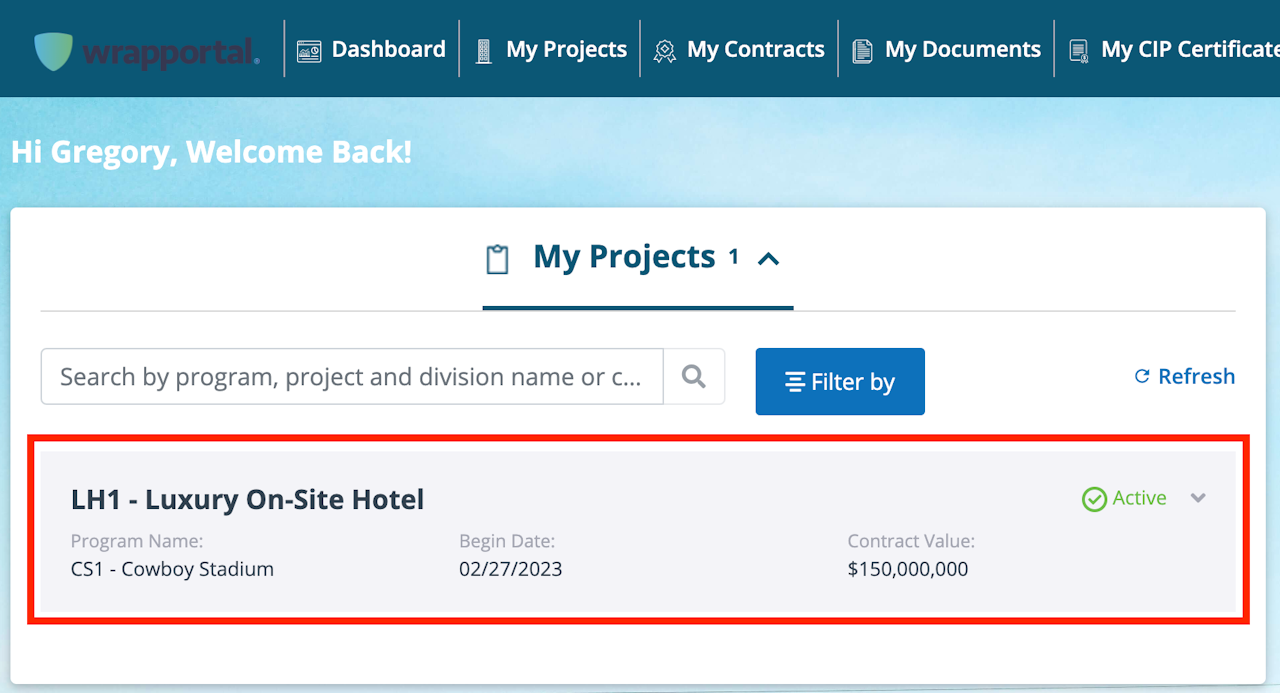
The project preview information that displays in the list includes the project name, CIP program name, estimated project begin date, estimated contract value, and project status.

Project Details Window
When you click on a project in the list, a window will expand below the record to show more details about the project.
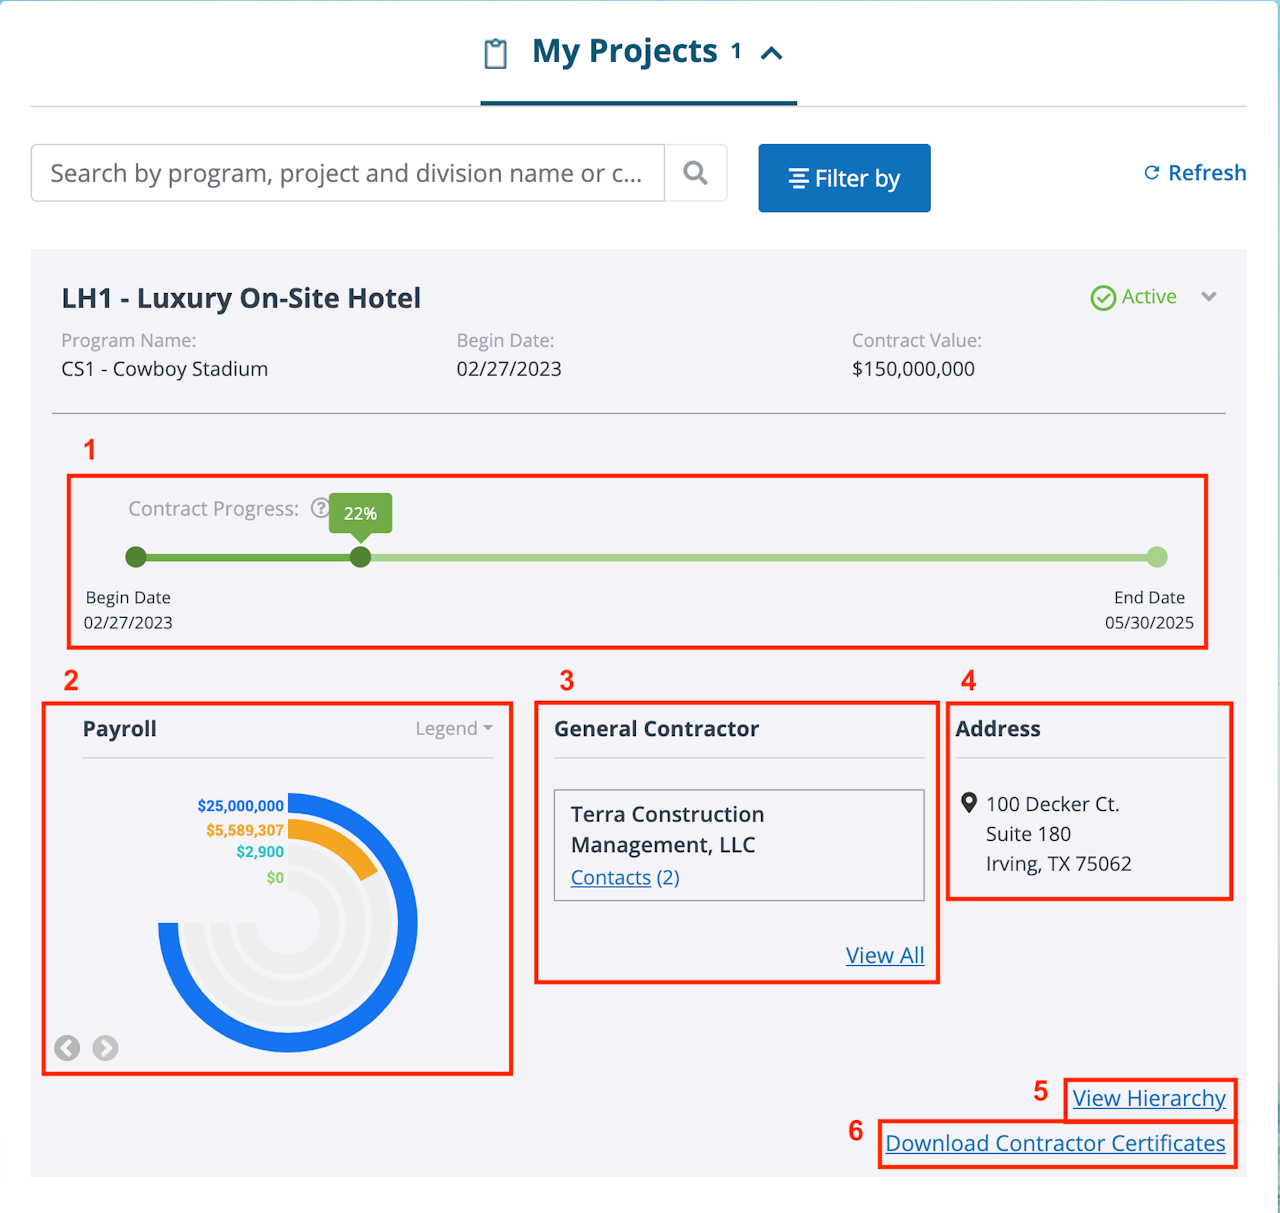
You will be able to see the following information about the project in the expanded window:
Project timeline
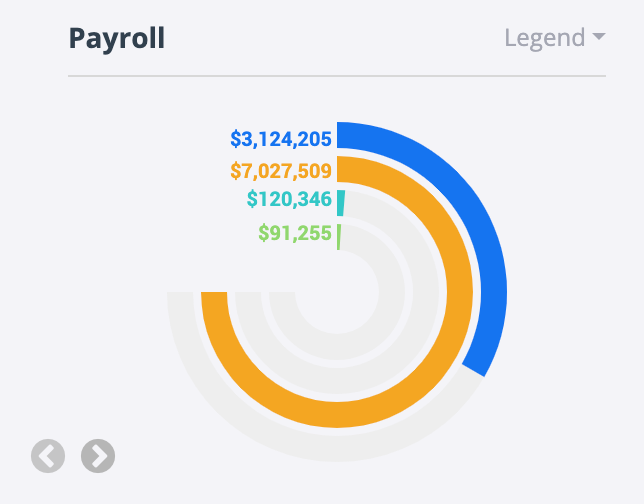
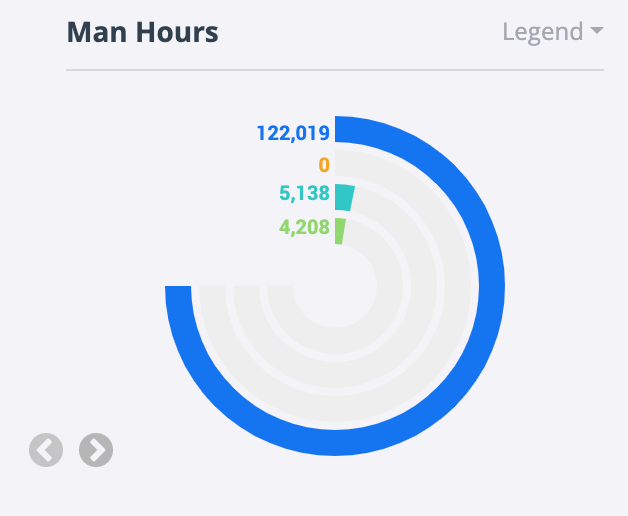
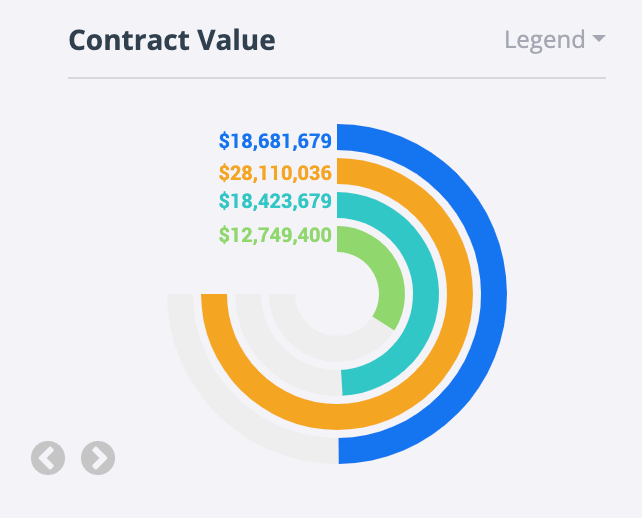
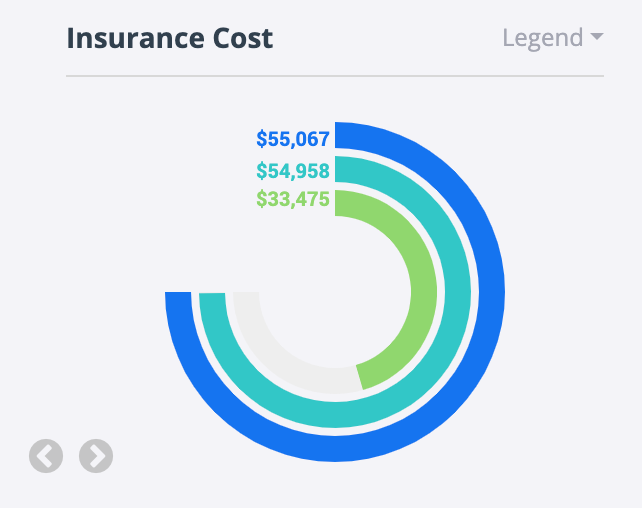
Comparison graphs for the contract value, payroll, man hours, and insurance cost
General contractor(s) and contact information
Project address
Project hierarchy
CIP certificates for the contracts on the project

Project Timeline
The timeline shows the current percent of completion for the project.
If the estimated begin and end dates for the project are not provided, the timeline will not display.

Graphs
The graphs on each project window provide a quick visual comparison of the project’s contract value, payroll, man-hours, and insurance cost.
Navigate through the graphs using the gray arrows to the bottom left of the graphs.

Additional Graphs
The graphs that appear and the values that display will vary depending on the type of CIP program and the type of information being tracked for the project. For example, if the CIP insurance cost is not being tracked for the project, the Insurance Cost graph will not display.

